Figure 2
Upper gut bacterial overgrowth is a potential mechanism for Glucose Malabsorption after Vertical Sleeve Gastrectomy
Timothy R Koch*, Timothy R Shope and Matthew E Sharbaugh
Published: 31 October, 2017 | Volume 1 - Issue 1 | Pages: 030-035

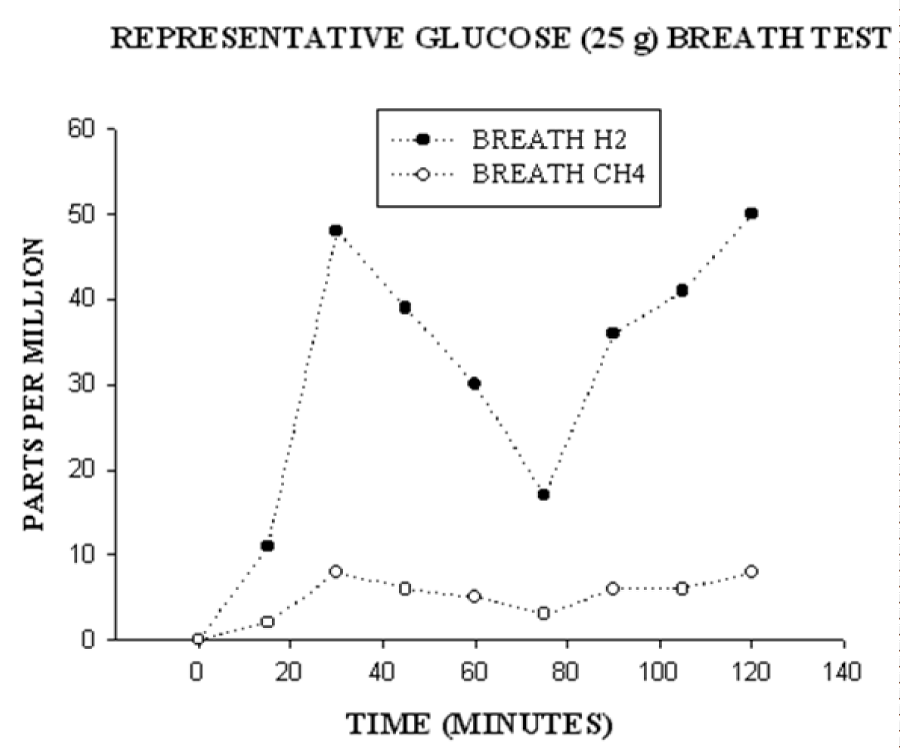
Figure 2:
Breath hydrogen (closed circles) and methane (open circles) were measured in parts per million at time 0 and then at 15 minutes intervals for 2 hours. After the fasting breath value at time 0, the subject was given 25 grams of glucose to drink. This graph shows a typical rise in breath hydrogen in a subject with two peaks: the first peak is consistent with upper gut bacterial overgrowth and the second peak is consistent with glucose malabsorption.
Read Full Article HTML DOI: 10.29328/journal.hodms.1001006 Cite this Article Read Full Article PDF
More Images
Similar Articles
-
Upper gut bacterial overgrowth is a potential mechanism for Glucose Malabsorption after Vertical Sleeve GastrectomyTimothy R Koch*,Timothy R Shope,Matthew E Sharbaugh. Upper gut bacterial overgrowth is a potential mechanism for Glucose Malabsorption after Vertical Sleeve Gastrectomy. . 2017 doi: 10.29328/journal.hodms.1001006; 1: 030-035
-
Dietary and Lifestyles assessment among Obese Women in Gaza City, PalestineMarwan O Jalambo*,Basil Kanoa,Mohammed S Ellulu,Smaher Younis,Mueen El-Kariri. Dietary and Lifestyles assessment among Obese Women in Gaza City, Palestine. . 2018 doi: 10.29328/journal.niogb.1001009; 2: 017-025
-
ECHO…for a change!!Manish Motwani*,Rajeev Palvia,Bhavesh Nanda,Mahek Motwani,Bhakti Chaubal,Jyoti Kesarkar, Bhakti Mange,Sneha Shukla. ECHO…for a change!!. . 2020 doi: 10.29328/journal.niogb.1001011; 4: 001-003
-
A Resurgence of the Idea of Hypertriglyceridemia and Lower Serum (HDL-C) as Predictive Factors for Insulin Resistance (IR) & Type 2 Diabetes Mellitus Development: A Narrative ReviewKulvinder Kochar Kaur*. A Resurgence of the Idea of Hypertriglyceridemia and Lower Serum (HDL-C) as Predictive Factors for Insulin Resistance (IR) & Type 2 Diabetes Mellitus Development: A Narrative Review. . 2025 doi: 10.29328/journal.niogb.1001022; 9: 001-012
Recently Viewed
-
Exceptional cancer responders: A zone-to-goDaniel Gandia,Cecilia Suárez*. Exceptional cancer responders: A zone-to-go. Arch Cancer Sci Ther. 2023: doi: 10.29328/journal.acst.1001033; 7: 001-002
-
The prognostic value of p53 and WT1 expression in cancer: new molecular insights and epigenetics explanations lead to a new medical hypothesisAhed J Alkhatib* and Ilham Ahed Alkhatib. The prognostic value of p53 and WT1 expression in cancer: new molecular insights and epigenetics explanations lead to a new medical hypothesis. Arch Cancer Sci Ther. 2023: doi: 10.29328/journal.acst.1001034; 7: 003-009
-
Anticancer Activity of Genistin: A Short ReviewMd Mizanur Rahaman*, Md Iqbal Sikder, Muhammad Ali Khan and Muhammad Torequl Islam. Anticancer Activity of Genistin: A Short Review. Arch Cancer Sci Ther. 2023: doi: 10.29328/journal.acst.1001035; 7: 010-013
-
Knowledge, Attitude, and Practice of Healthcare Workers in Ekiti State, Nigeria on Prevention of Cervical CancerAde-Ojo Idowu Pius*, Okunola Temitope Omoladun, Olaogun Dominic Oluwole. Knowledge, Attitude, and Practice of Healthcare Workers in Ekiti State, Nigeria on Prevention of Cervical Cancer. Arch Cancer Sci Ther. 2024: doi: 10.29328/journal.acst.1001038; 8: 001-006
-
Oral Cancer Management is not just Treatment! But also, how early Pre-cancerous Lesions are Diagnosed & Treated!!Suresh Kishanrao*. Oral Cancer Management is not just Treatment! But also, how early Pre-cancerous Lesions are Diagnosed & Treated!!. Arch Cancer Sci Ther. 2024: doi: 10.29328/journal.acst.1001039; 8: 007-012
Most Viewed
-
Effects of dietary supplementation on progression to type 2 diabetes in subjects with prediabetes: a single center randomized double-blind placebo-controlled trialSathit Niramitmahapanya*,Preeyapat Chattieng,Tiersidh Nasomphan,Korbtham Sathirakul. Effects of dietary supplementation on progression to type 2 diabetes in subjects with prediabetes: a single center randomized double-blind placebo-controlled trial. Ann Clin Endocrinol Metabol. 2023 doi: 10.29328/journal.acem.1001026; 7: 00-007
-
Physical Performance in the Overweight/Obesity Children Evaluation and RehabilitationCristina Popescu, Mircea-Sebastian Șerbănescu, Gigi Calin*, Magdalena Rodica Trăistaru. Physical Performance in the Overweight/Obesity Children Evaluation and Rehabilitation. Ann Clin Endocrinol Metabol. 2024 doi: 10.29328/journal.acem.1001030; 8: 004-012
-
Hypercalcaemic Crisis Associated with Hyperthyroidism: A Rare and Challenging PresentationKarthik Baburaj*, Priya Thottiyil Nair, Abeed Hussain, Vimal MV. Hypercalcaemic Crisis Associated with Hyperthyroidism: A Rare and Challenging Presentation. Ann Clin Endocrinol Metabol. 2024 doi: 10.29328/journal.acem.1001029; 8: 001-003
-
Exceptional cancer responders: A zone-to-goDaniel Gandia,Cecilia Suárez*. Exceptional cancer responders: A zone-to-go. Arch Cancer Sci Ther. 2023 doi: 10.29328/journal.acst.1001033; 7: 001-002
-
The benefits of biochemical bone markersSek Aksaranugraha*. The benefits of biochemical bone markers. Int J Bone Marrow Res. 2020 doi: 10.29328/journal.ijbmr.1001013; 3: 027-031

If you are already a member of our network and need to keep track of any developments regarding a question you have already submitted, click "take me to my Query."


